
This affects every aspect of the scheme’s finances, from its funding valuations to transfer values and accounting disclosures. It has been brought into focus in recent years for two reasons. Firstly, declining interest rates have increased the value of survivor pensions relative to the nearer-term pensions payable to members. Secondly, pension schemes are increasingly focused on long-term funding, including the use of insurance solutions such as bulk annuities to hedge their demographic and financial risks. In an irrevocable transaction of this kind it is vital value liabilities accurately to ensure the premium represents value for money.
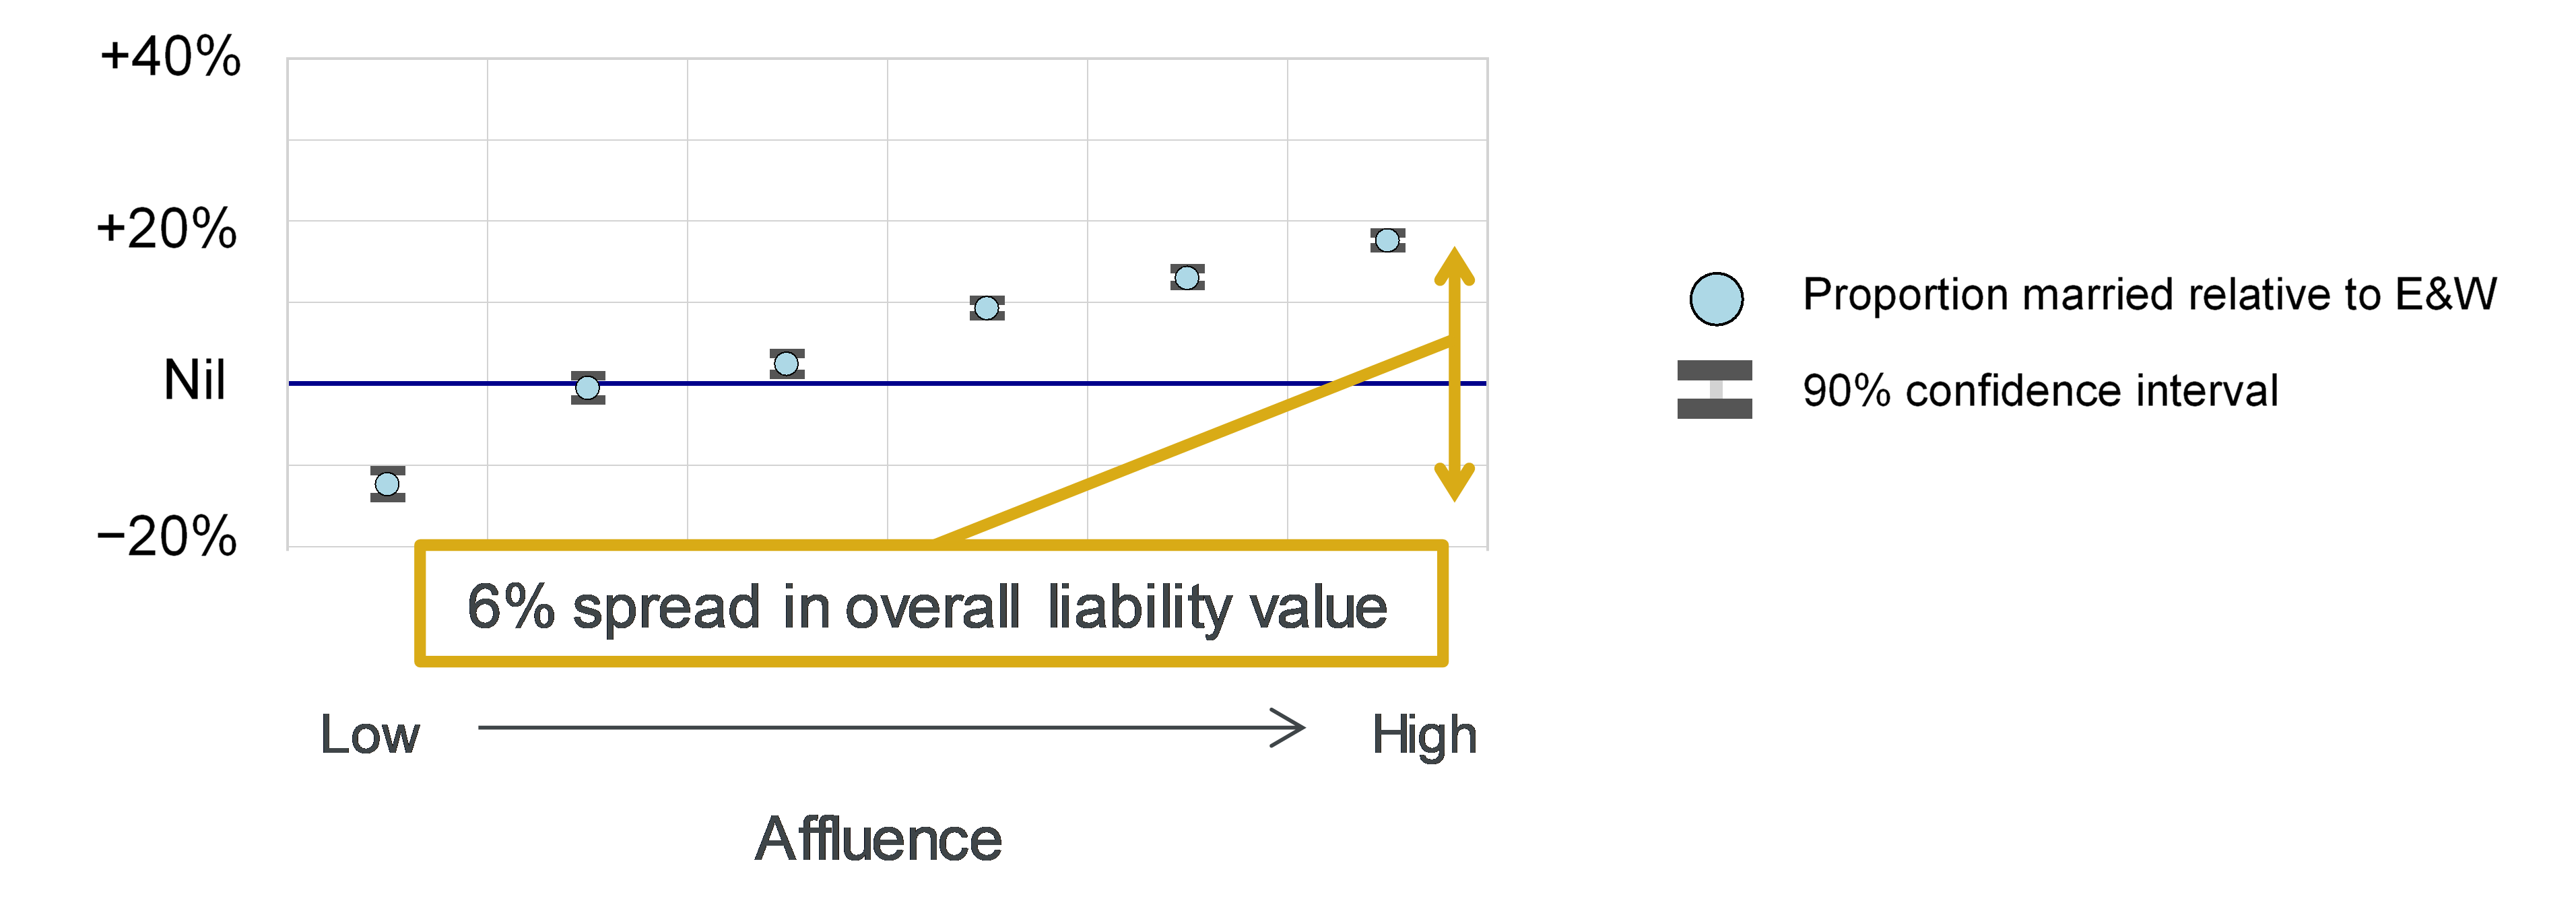
Schemes usually record members’ marital details only at set points, for example at retirement or death (to check whether a survivor pension is payable). So, there is often no reliable current record of who has a qualifying dependant. Furthermore, there is huge variation in marital proportions between schemes, so it is insufficient simply to use national averages as a guide. Research by Aon indicates that affluent pensioners are up to 30% more likely to be married than less affluent pensioners, a gap of around 6% in pension liabilities (Figure 1).
Note 1
So, how can we assess a scheme’s marital profile?
Experience analysis
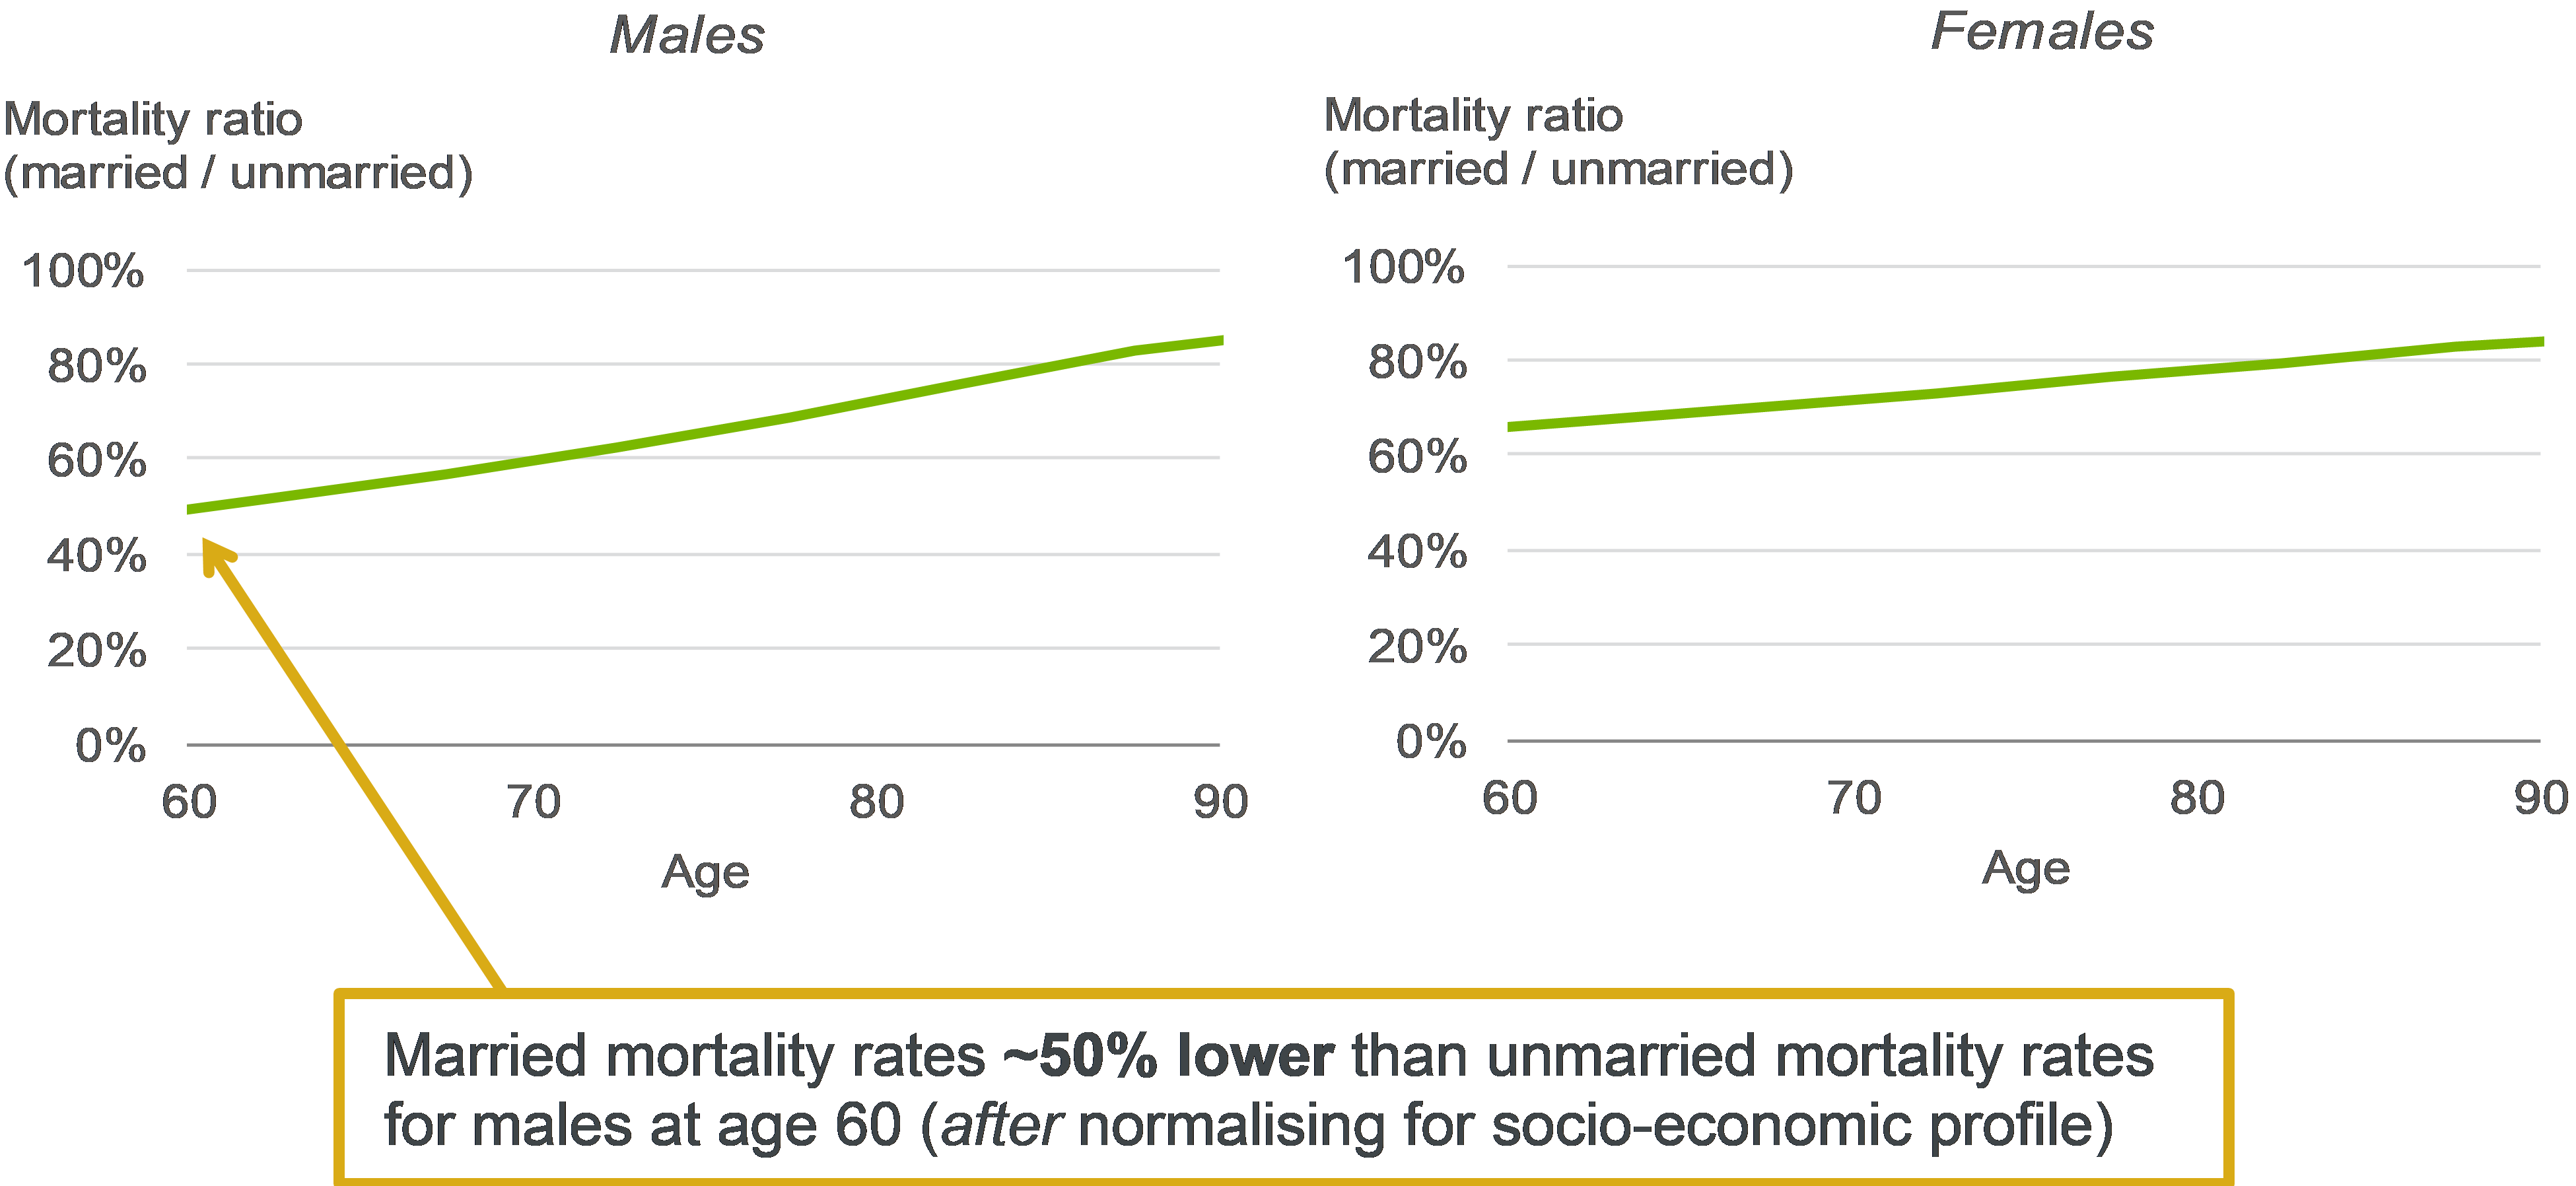
One answer is to review the data for recently deceased pensioners. Administrators typically record which deaths gave rise to survivor pensions, and actuaries have traditionally used this as a guide to dependant proportions in the current population. The problem is that deceased members have a different profile to current members. Mortality rates tend to be higher for the older and less affluent and, even after normalising for this, married individuals exhibit significantly lower annual mortality rates than unmarried individuals (Figure 2). This may be due to indirect factors such as greater social connectivity, or the direct benefit of having someone to help if you are ill or suffer a fall. In either case, it means that members who have recently died were less likely to be married than the surviving members in the scheme.
Note 2
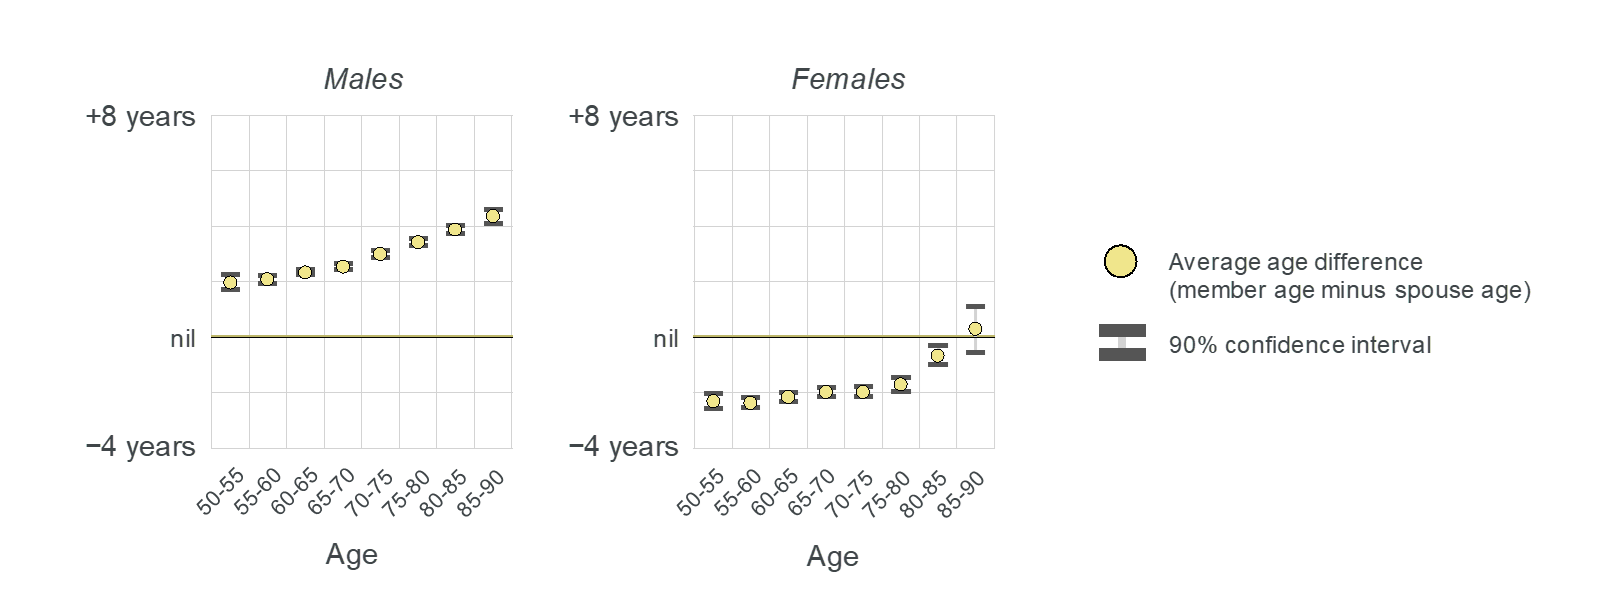
There is a similar problem for age difference because this tends to be higher (members have relatively younger partners) when the members themselves are older (Figure 3). This makes sense given the impact of mortality at older ages – a 90-year old is more likely to have a surviving spouse if they had married someone five years younger rather than five years older. It does, however, mean that the average age difference of deceased members may be unrepresentative of the age difference of the current (younger) members with partners. For schemes that require accurate dependant assumptions, including those approaching the insurance market, it is critical to analyse their current lives.
Marital surveys
The simplest approach is to write to members, asking them to confirm their marital details. A well-designed
survey can be very effective, but there are two common hurdles:
- Cost – posting questionnaires and processing responses can cost £20 per member or more, and
- Non-respondent bias – not all members respond to a survey so an assumption is needed for those who don’t respond. Response rates tend to be lower for single members (who may see the exercise as less relevant to them), so assuming the same dependant proportion for those who did not respond is unlikely to be accurate.
The bias depends on the questionnaire wording – and not allowing for the bias can risk overstating total liabilities by as much as 2%.
Note 3
Member tracing
A second approach is member tracing, which is a
non-invasive service offered by several data analytics agencies in the UK. These agencies check a range of public and proprietary data sources to predict marital status at an individual level. The result is a trace code such as ‘married’, ‘single’ or ‘cohabiting’ and, where
relevant, the partner’s estimated birth date.
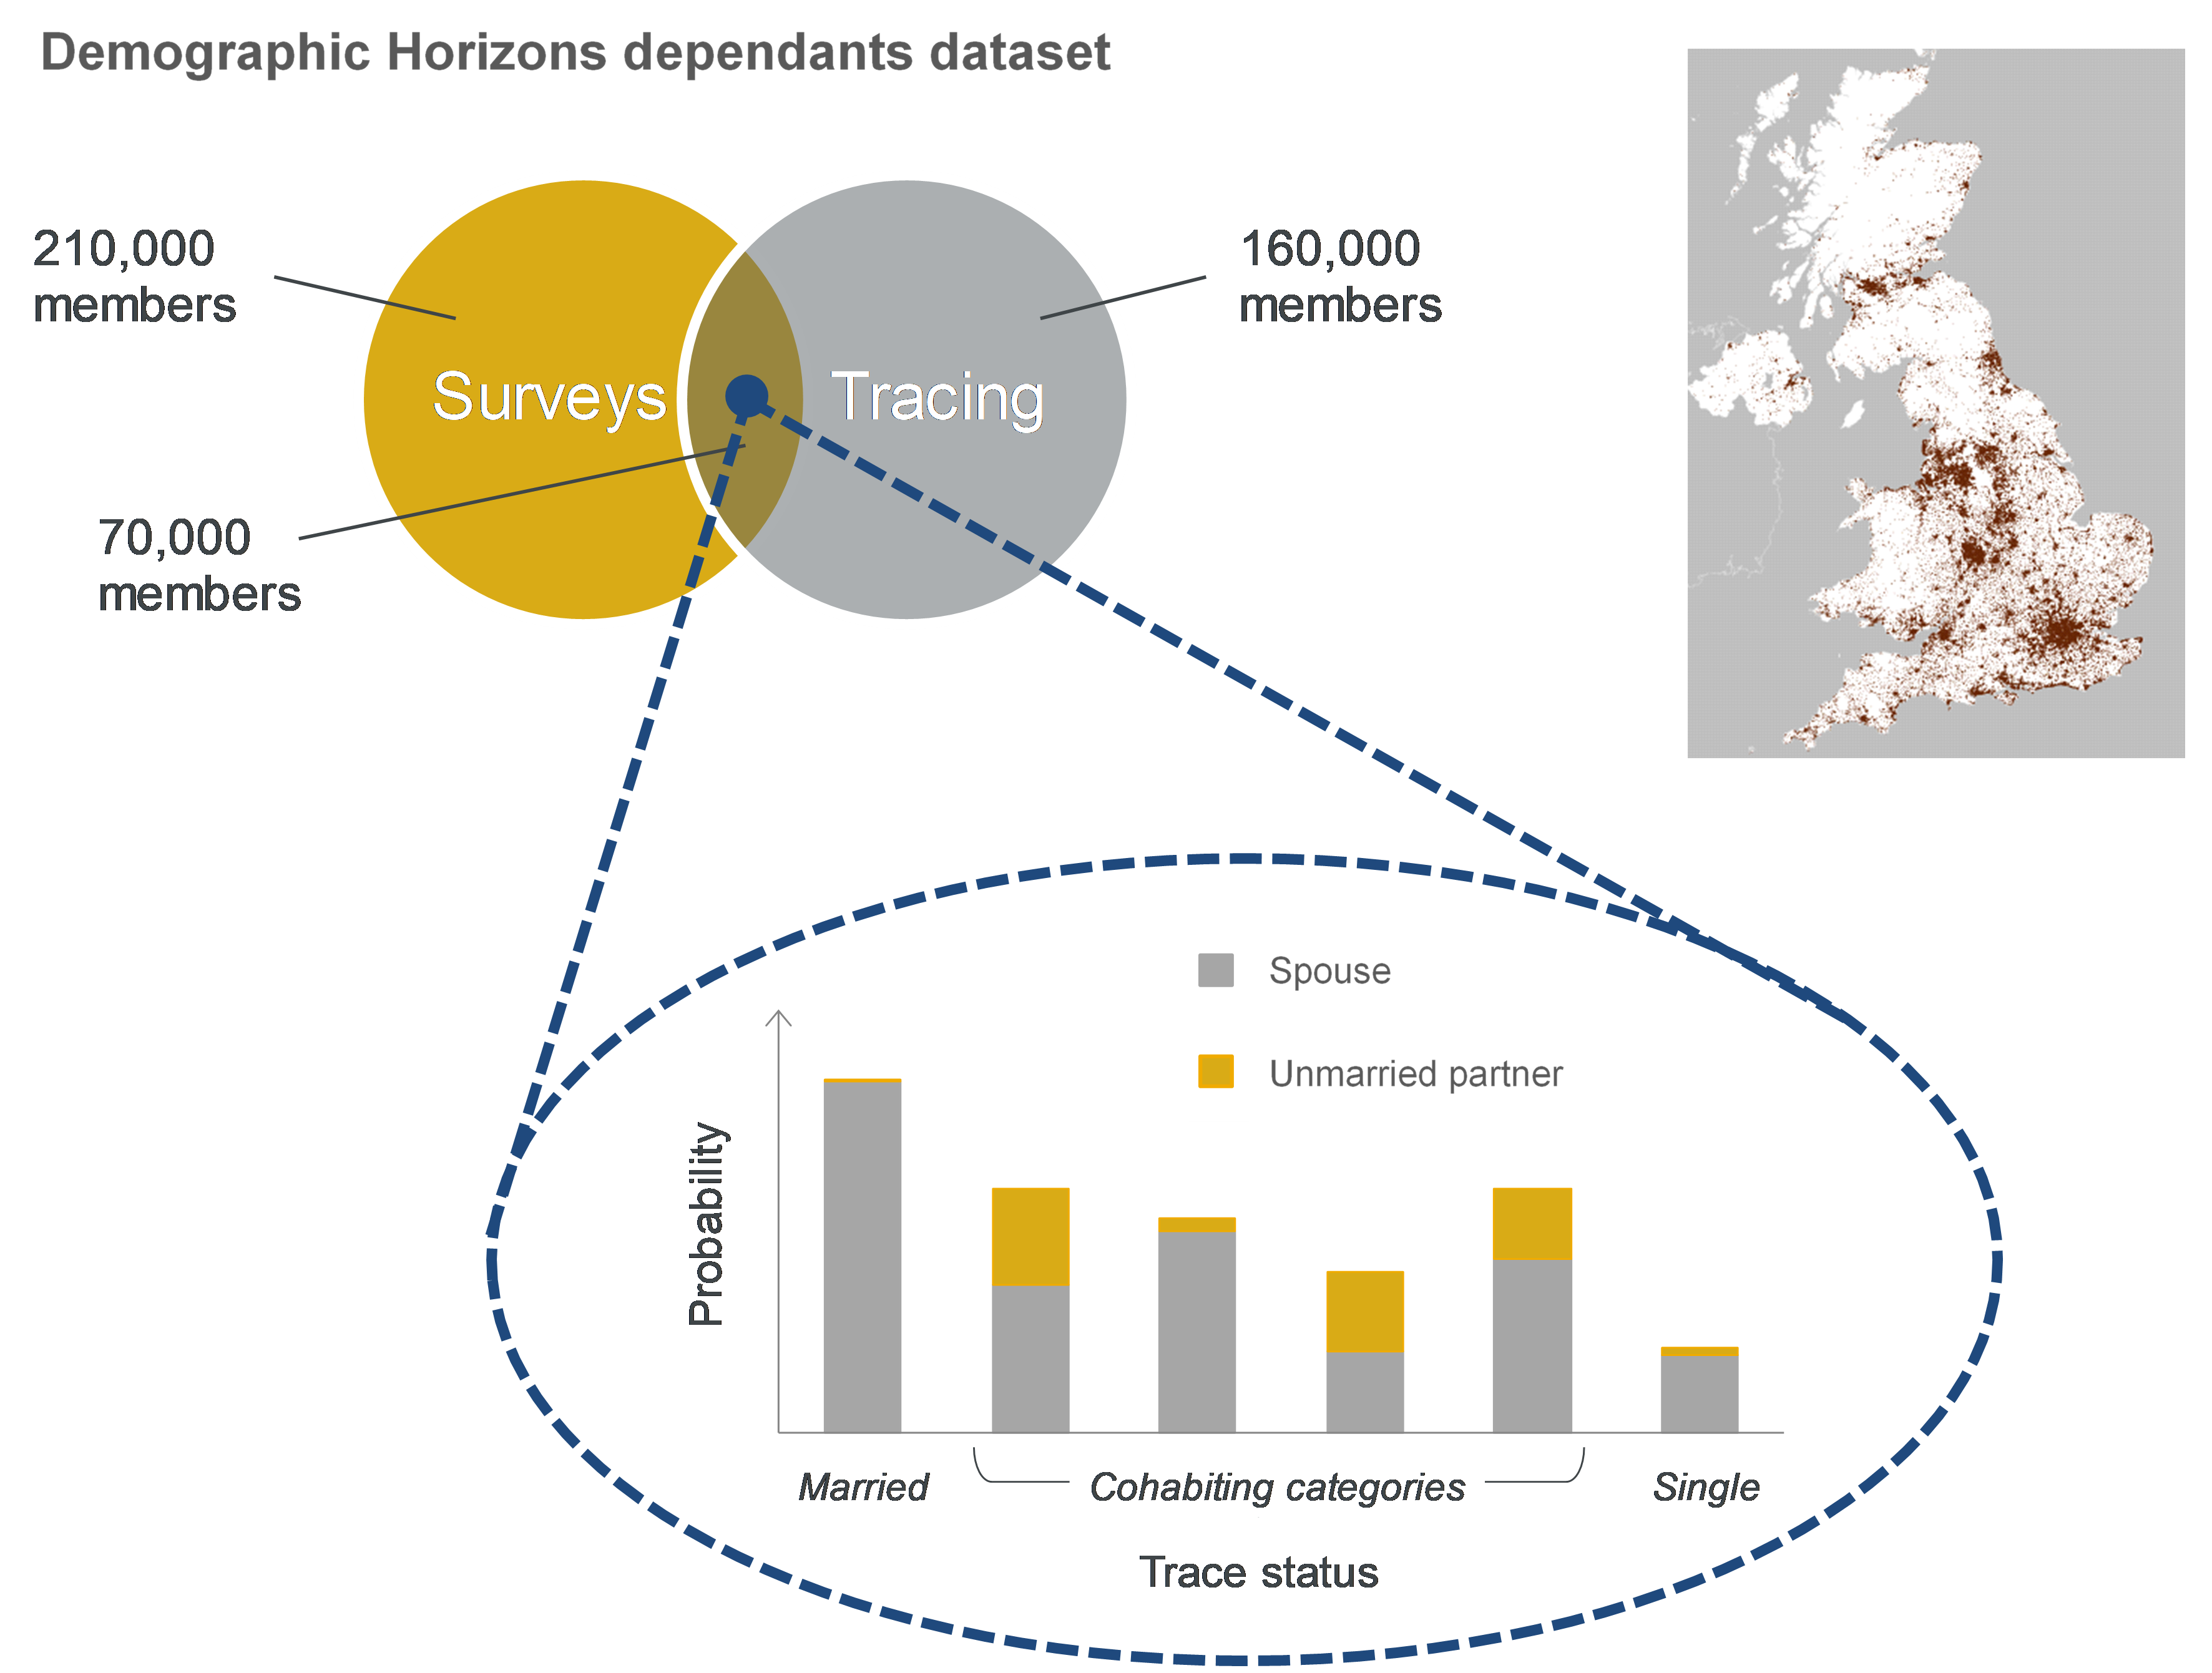
As tracing is not reliant on members responding, it can be quicker and cheaper than a survey, and is unaffected by non-respondent bias. However, the codes returned are only predictions of marital status – their reliability depends on the agency used and the quality of their algorithms. At Aon we have determined the probability of being married (or having an unmarried partner) for each trace code by comparing trace results to known survey responses for the same individuals, for a large multi-scheme dataset (Figure 4). This probability mapping allows us to use marital tracing to determine realistic assumptions.
Postcode profiling
For schemes that have not carried out a survey
or trace, a robust postcode model can estimate
dependant proportions and age difference for current members based on their age, sex and socio-economic profile. This can help to avoid surprises further down the line, for example, if survey or tracing data is later collected for bulk annuity quotations. In one recent case, the collection of marital data revealed that
liabilities would have been underestimated by circa £100million based on simple experience analysis, whereas Aon’s postcode model had predicted the correct dependant proportions. Very simply, the schemes that have accurate information on their marital profile are better equipped to manage their finances for the future.
Notes/Sources
Note 1
* Amounts-weighted pension scheme survey data from Aon’s Demographic Horizons dataset (adjusted for respondent bias) vs ONS E&W 2011 census data (projected from 2011 using annual adjustments from ONS Labour Force Survey). Affluence groups are defined by socio-economic classification of postcode. The marital proportions observed in the Demographic Horizons dataset may differ from the ‘true’ proportions for typical male pensioners due to random statistical noise (i.e. simply by chance, the members we are looking at may include more or fewer married individuals than average). We have shown ‘90% confidence intervals’ on the chart to capture this. There is a 90% chance that the true average proportion married for each group lies within the interval plotted.
Note 2
* Standardised by Index of Multiple Deprivation (IMD) decile, 2015 classification. Source: ONS data with Aon calculations
Note 3
* Amounts-weighted pension scheme survey data from Aon’s Demographic Horizons dataset. The age differences observed in the Demographic Horizons dataset may differ from the ‘true’ average age differences for typical pensioners due to random statistical noise (i.e. simply by chance, the members we are looking at may have older or younger partners than average). We have shown ‘90% confidence intervals’ on the chart to capture this. There is a 90% chance that the true average age difference for each group lies within the interval plotted.
This article was featured in Pensions Aspects magazine May 2020 edition.
Last update: 1 August 2024

You may also like: